|
|
| Back to Home page. |
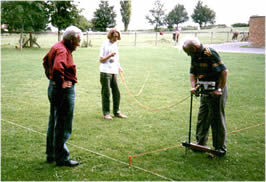 |
In the summer of 2000 the group asked
Peter Cott, who has a resistivity meter, to come to Thriplow
and survey an interesting area in the field next to the school. A resistivity meter measures changes in electrical resistance in the soil by passing an electrical current between probes set in the ground. The resistance to the passage of the current is measured and then translated by a computer into a plot as shown below. It is one way of finding hidden structures under the ground. |
 |
|
 |
A
is pointing towards an area
of high resistance (dark coloured) enclosed by a reverse "L" shaped area
of low resistance. (light coloured) This
follows the line of a shallow ditch.
B is pointing towards another area of high resistance abutting a low resistance area. This may indicate the straight edge of a paved area under the ground. |
| Links to more details | |
| Documentary evidence | Plane table surveying |
| Place name analysis | Resistivity surveying |
| Aerial photography analysis | Dowsing and pond dipping |
| Geology | Courses and visits |
| Soil sampling | Community links |
| Metal detecting | Acknowledgements |
